Beyond Stereotypes: What Bay Area Teen Substance Data Reveals (Part II)
Following last week’s Part I focus on youth and teen substance abuse long-term trends at the national level, this week we examine local teen data to better understand the landscape in the Bay Area.
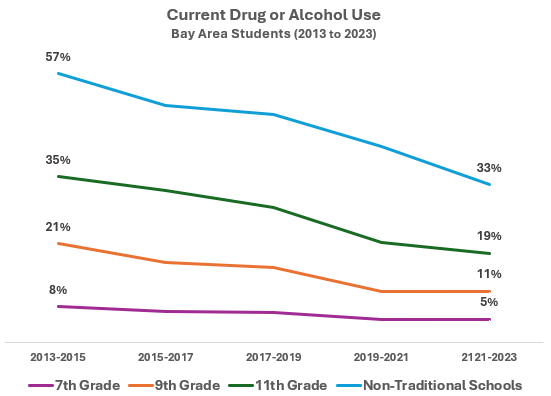
Our analysis reveals a remarkable 43% decline in teen substance use over the past decade, though significant variations exist across demographics.
Specifically, we'll analyze local trends over time and the profile of youth with substance abuse issues by grade level, county, socioeconomic status, gender, and emotional wellbeing.
Adolescence represents a critical developmental period with the highest risk for addiction and long-term neurological damage. By understanding current patterns of substance use among Bay Area teens, we can better target prevention and intervention efforts.
_______________
For this analysis, we use the California Department of Education's Healthy Kids Survey data, which collects information from 7th, 9th, and 11th graders as well as students in non-traditional schools. Non-traditional schools serve students who are at risk of dropping out, have irregular attendance, or have been expelled.
We focus on recent drug or alcohol use, defined as using substances within the last 30 days. This metric represents the percentage of students who reported substance use during this period.
Given this is a school-based survey of underage users, we expect the results to understate the full extent of substance use, but the data still provides valuable insights into relative trends and patterns.
_______________
A Decade of Decline
The data reveals a remarkable decline in the percentage of students using drugs and alcohol over the last decade:
Overall reduction of 43% across all grade levels
The largest decline occurred among 9th graders, falling from 21% to 11%
Current usage rates by educational level show:
Non-traditional school students: 33% (highest)
11th graders: 19%
9th graders: 11%
7th graders: 5% (lowest)
_______________
County Variations in Substance Use
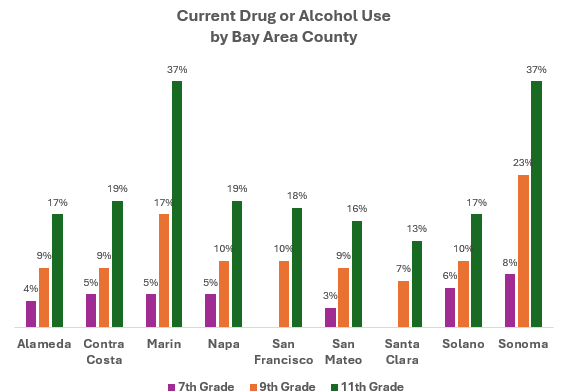
When examining alcohol and drug usage by Bay Area county, several patterns emerge:
The North Bay counties of Marin and Sonoma stand out with significantly higher usage rates across grade levels. In 11th grade, both counties report 37% of students using regularly—approximately double the rates seen in most other Bay Area counties.
Santa Clara has the lowest levels, with only 7% of 9th graders and 13% of 11th graders reporting usage.
Notably, there is no clear correlation between county affluence and substance use rates
_______________
Parental Education Factor
While the county data showed no clear correlation with substance use rates, individual family backgrounds reveal more nuanced patterns.
We compared substance use rates between students at opposite ends of the socioeconomic spectrum: those whose parents didn't graduate high school and those whose parents hold college degrees or higher.
The findings reveal a striking pattern:
Students whose parents didn't graduate high school demonstrate significantly higher substance use rates at an early age - 11% of these 7th graders report current use compared to just 4% of students with college-educated parents (nearly triple the rate)
However, by 11th grade, this pattern reverses - students with college-educated parents report higher usage rates (23%) than those whose parents didn't complete high school (20%)
This suggests different risk trajectories based on socioeconomic factors, with economically disadvantaged youth initiating substance use earlier, while more affluent teens catch up or surpass them by late high school
_______________
The Gender Divide
Gender analysis reveals a consistent and concerning pattern:
Female students report higher substance use rates than males across all grade levels
On average, 24% more girls are using these substances than boys
This finding warrants particular attention as it may reflect mental health concerns and differing coping mechanisms, which leads us to our next area of analysis.
_______________
The Mental Health Connection
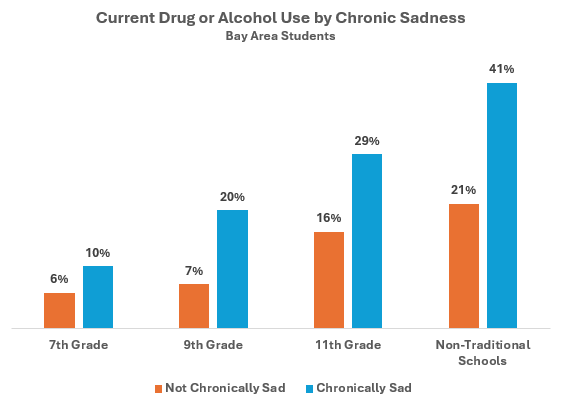
The most dramatic differences emerge when comparing students who report chronic feelings of sadness or hopelessness versus those who don't:
Students experiencing chronic sadness report substance use rates 200% higher than their peers without such feelings
This strong correlation suggests either that students are using substances as self-medication for emotional distress, that substance use is contributing to their mental health challenges, or most likely, that both factors are reinforcing each other in a harmful cycle.
This finding underscores the critical importance of integrated approaches to teen mental health and substance abuse prevention.
_______________
Conclusion
Our analysis of Bay Area teen substance use reveals several key insights:
Overall rates have declined 43% over the past decade, though risks remain for specific groups
North Bay counties (Marin and Sonoma) show substantially higher usage rates
Lower-income youth start using earlier, while more affluent teens show higher rates by 11th grade
Female students consistently report higher substance use than males
Students experiencing chronic sadness use substances at rates 200% higher than peers
Next week, we'll examine marijuana use specifically, including evolving risks related to changing legalization policies and increasing potency.


